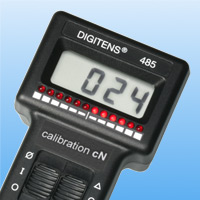
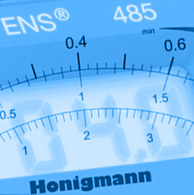
|  | Digitens 485 - DynGraph
displays the dynamic parts of the tension signal | |
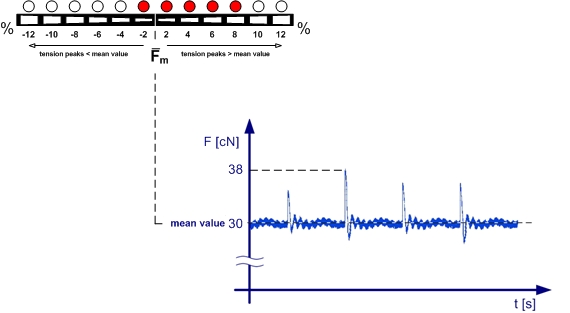
 | | | accurate display of the tension peaks
as well as their duration and frequency of occurrence
the DynGraph display is relative to the mean value
scale: one LED corresponds to 2%
of the sensors rated force |
|
| Description | |
The measuring amplifier Digitens is provided with a digital display.
The analog signals of the connected sensor are digitized for that purpose.
For analog / digital conversion an integrating measuring method averaging over 0,5 seconds is used. The dynamic parts of the tension signal - its amplitude and frequency of occurrence - are not displayed because of the generation of mean value.
In many processes, e.g.
- spinning
- weaving
- texturizing etc.
especially the dynamic parts, e.g. the tension peaks and their frequency of occurrence,
are important information.
The additional display DynGraph - based on LED-technology - works without delay and shows correct amplitudes up to high frequencies.
It offers - additional to the quasi static mean value of the digital display - the information on the dynamic.
examplary graphic:
sensor 100cN, pulse frequency 150Hz
The Digitens DT485 with additional display DynGraph quickly offers precise information about the tension in your process without any complex accessories. |
 |  |
| PreView | |
| Related products | |
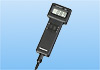
to product page | | Digitens® 485
hand-held
for capacitive meas. cells
digital display
auto-zero / hold / peak
|
| | |
|
| | | PRODUCTS |
|  | |
|

)